


01/04
01/04
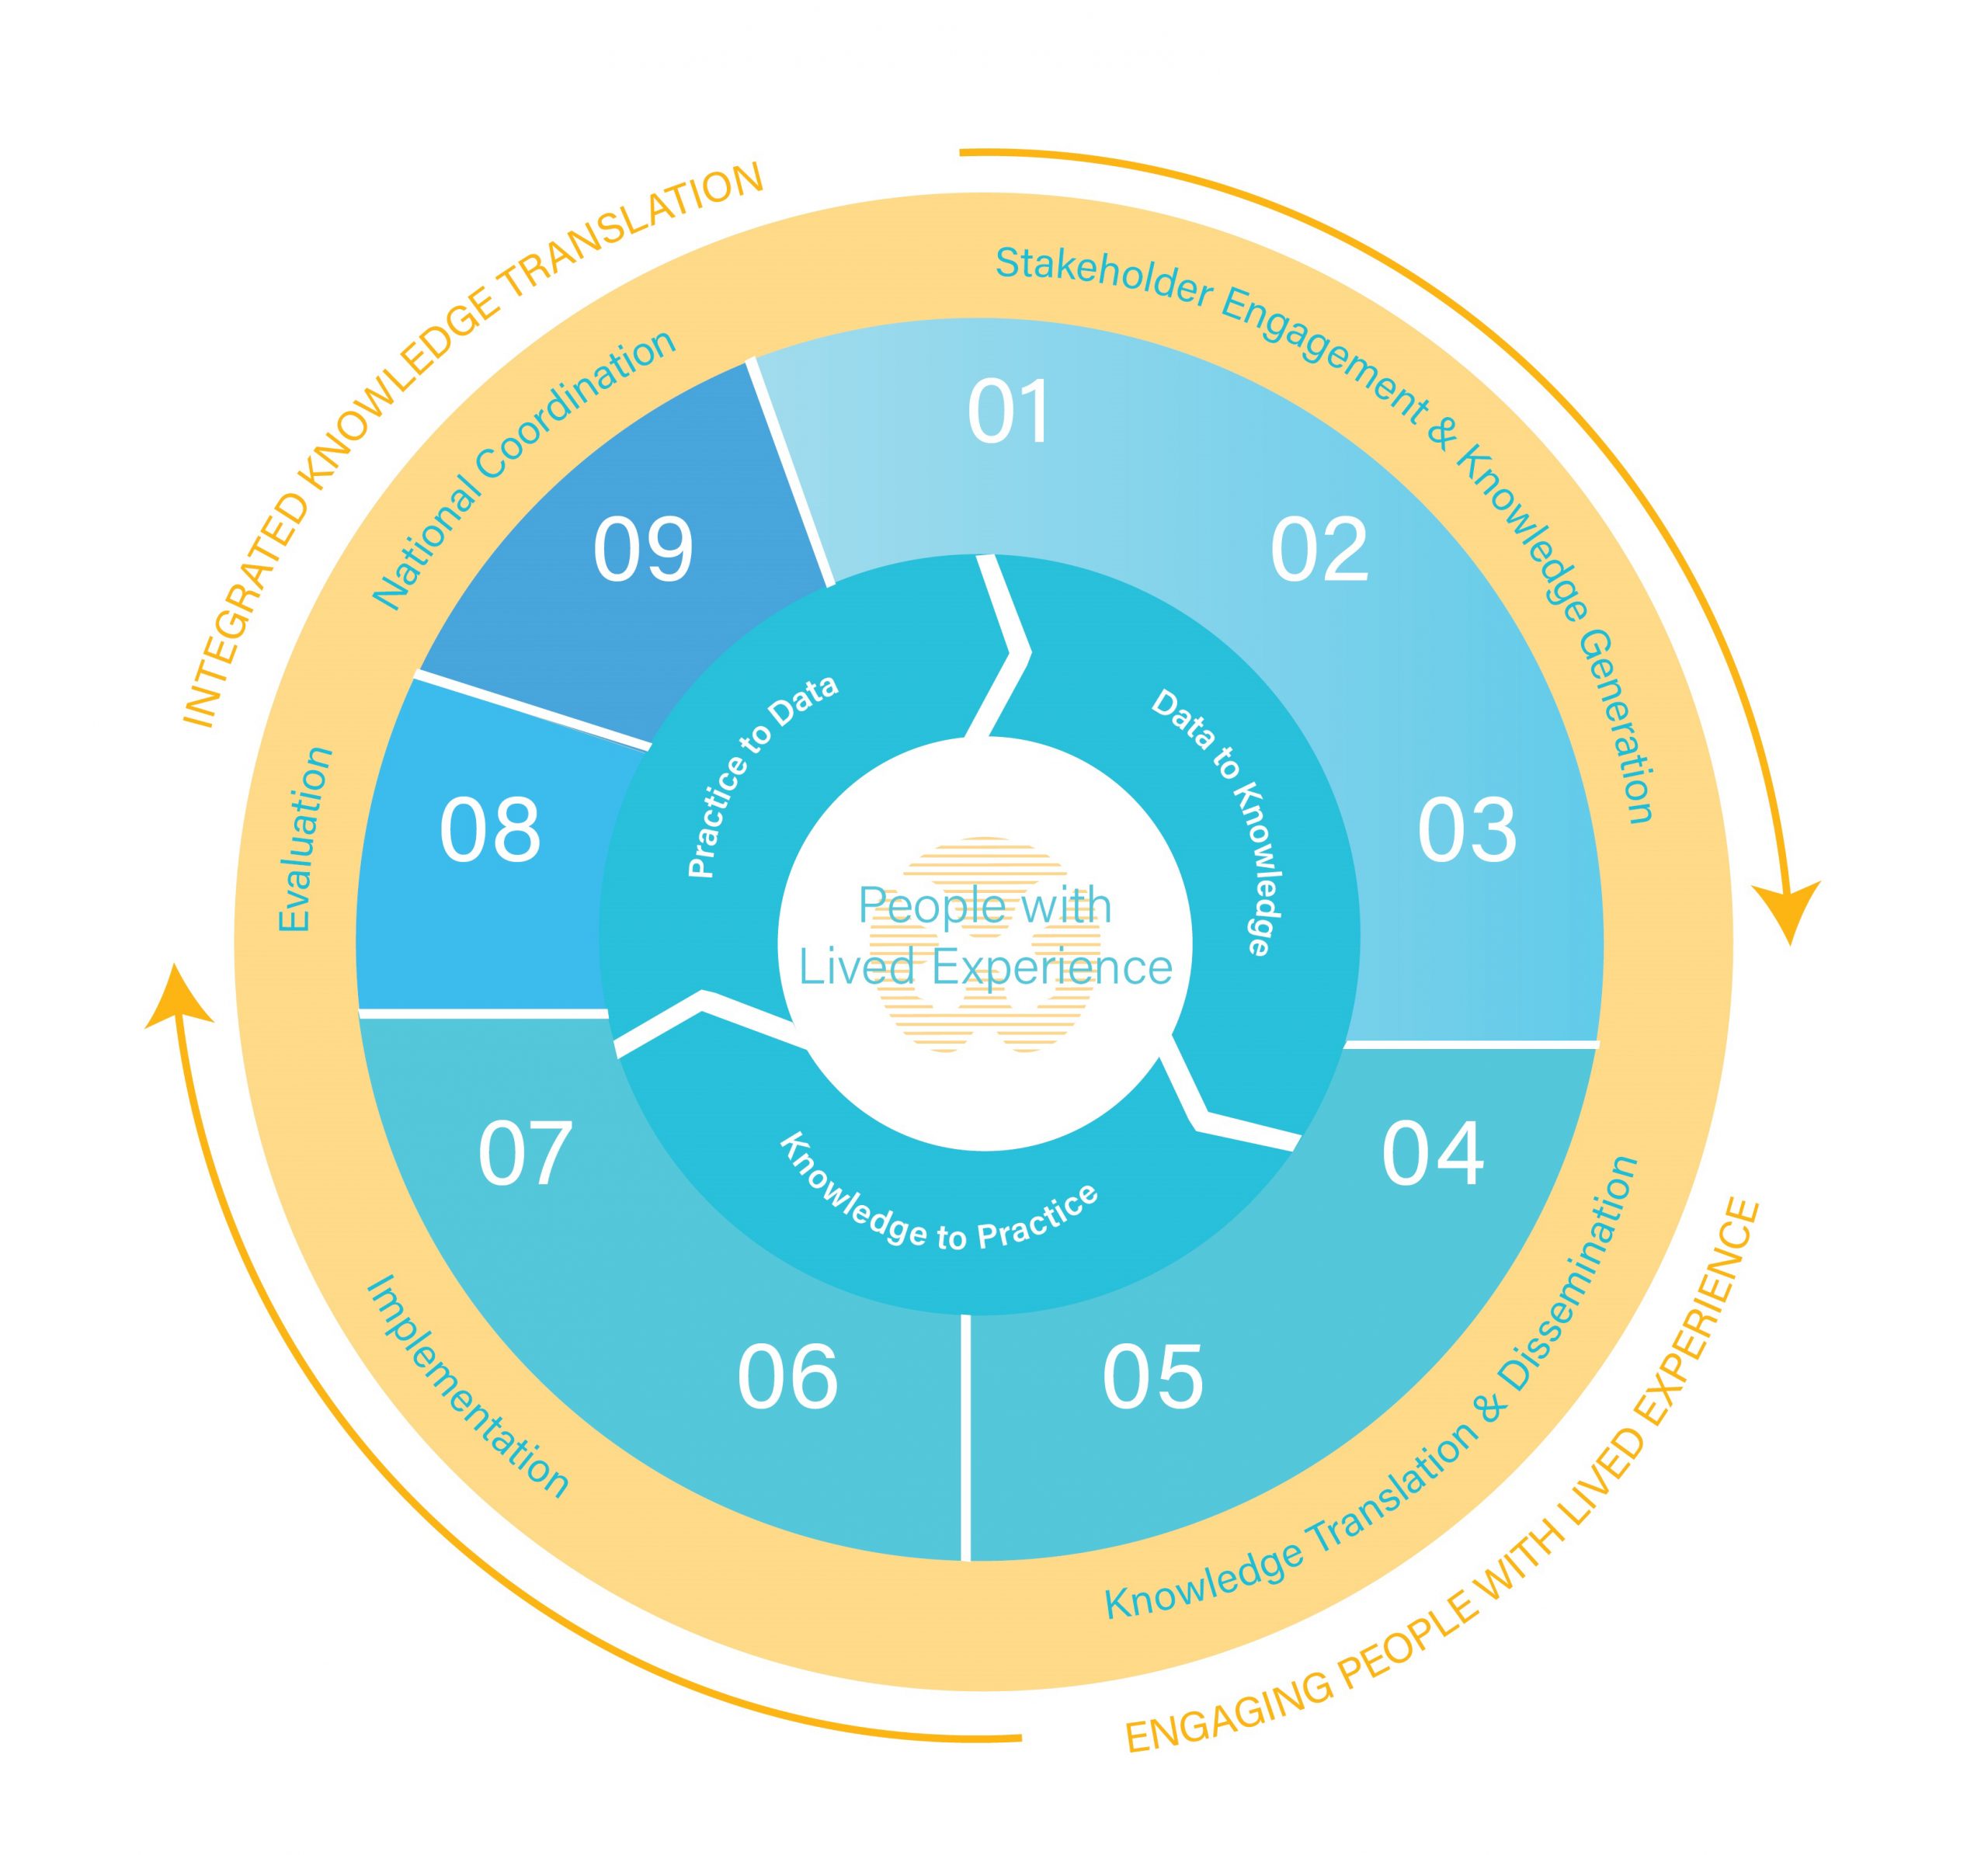
Praxis Data-Knowledge-Practice-Cycle
Applying a learning health systems approach to change the future of spinal cord injury care.
02/04
02/04
Knowledge is Power
Check out SCI-related scientific publications, white papers, conference proceedings, and evaluation reports.
03/04
03/04
Grants & Funding
Discover the latest in grants and funding at Praxis Spinal Cord Institute.

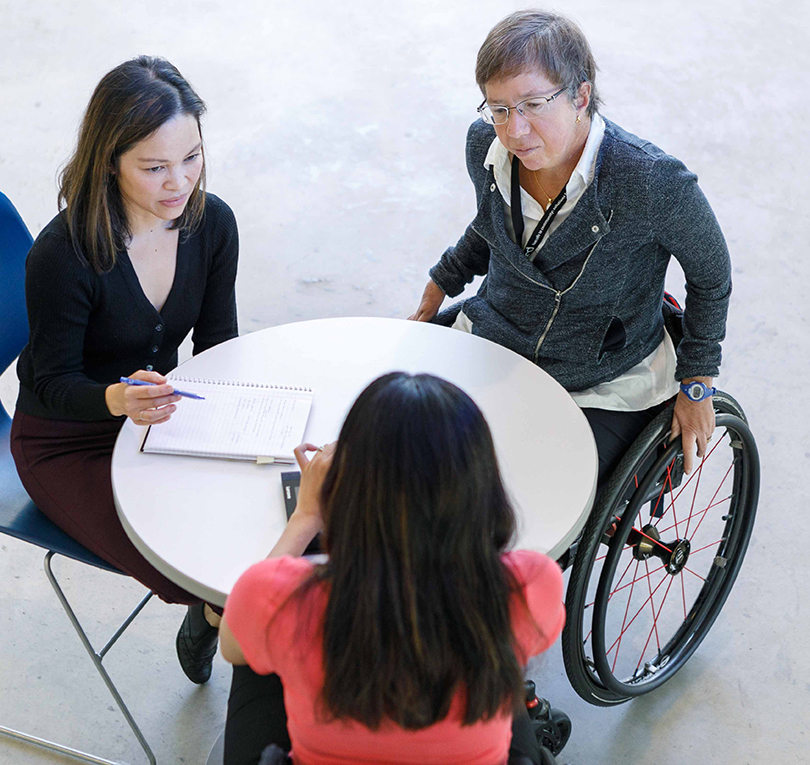
We Are Praxis Spinal Cord Institute
Praxis is a Canadian-based not-for-profit organization that leads global collaboration in spinal cord injury research, innovation and care. We accelerate the translation of discoveries and best practices into improved treatments for people with spinal cord injuries.
Latest News
Keep up-to-date with the latest news and updates from Praxis.

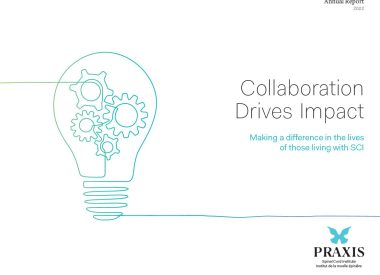
Read the Praxis annual report 2022
October 26, 2023
We are pleased to share the 2022 Praxis Annual Report with you, which focuses on collaboration and how it drives impact. The…
Read More

Implementing Activity-Based Therapy for Spinal Cord Injury Rehabilitation in Canada: Challenges and Proposed Solutions
April 8, 2024
Activity-based therapy (ABT) is a therapeutic approach with multiple benefits including promoting neurorecovery and reducing the likelihood of secondary complications in people…
Read More
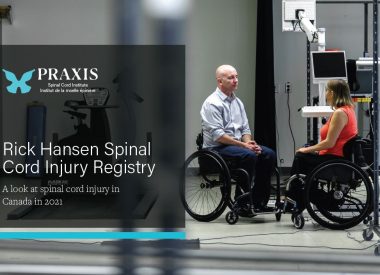
A look at Spinal Cord Injury in Canada in 2021
January 12, 2024
Published in 2023, The RHSCIR network report is a detailed look at clinical and demographic data collected from 682 tSCI and 466…
Read More
Standing and Walking Assessment Tool (SWAT)Information at practitioner fingertips for best practices in care
December 4, 2023
Improved patient outcomes are being delivered by the Standing and Walking Assessment Tool (SWAT), which helps health practitioners target therapies to help…
Read More
Key Initiatives + Resources
Our Impact
At Praxis, we are driven by our vision of a world without paralysis after SCI. Since 2009, we have worked to make exceptional improvements in the health of people with SCI.
Co-Creating a National SCI Care Strategy
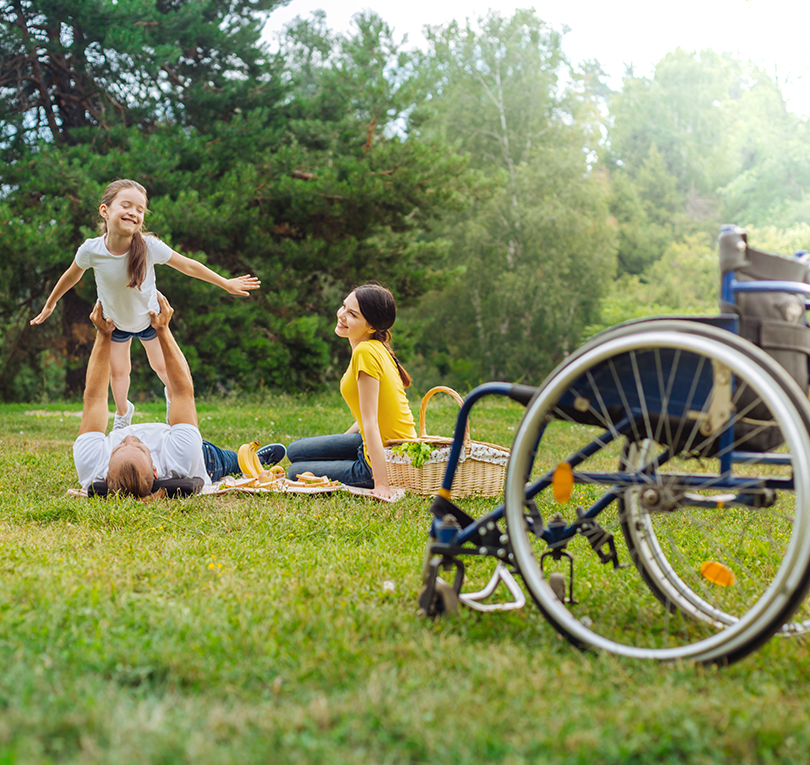
How Would You Like To Change The World?
Imagine improving the lives of millions of people around the world who live with a spinal cord injury.
DONATE NOW

Imagine a world without paralysis after spinal cord injury.